Skip to content

Destructive measurements of litter load

Pellizzaro, G.1, Scarpa, C.1, Bacciu, V.1

1National Research Council of Italy – Institute for the BioEconomy

Last updated: 24/09/2026

Recommended citation:

Pellizzaro, G., Scarpa, C., & Bacciu, V.. 2026. Destructive measurements of litter load. In: Pere Casals, Davide Ascoli, Lena Vilà-Vilardell, Imma Oliveras, Madoka Krick (eds.) 2026. Methods handbook for characterizing fire use behavior, assessing fire effects, and monitoring soil and vegetation responses at the stand level. FIRE-ADAPT project (number 101086416), deliverable D1.1

Indicator

Fuel load: Surface fuel loading

Brief introduction

Litter and fine woody fuels are the most significant factors in advancing the fire front. They ignite and burn more easily and quickly than large wood fuels because they require less heat to lose moisture and reach the ignition temperature

To estimate the litter load, sampling frames are positioned inside the plot, and the material within them is collected and brought to the laboratory to dry and determine the dry weight. It is measured in terms of dry weight per unit area.

Method specifications

Method type

Soft

Hard

Method timing

Before
fire

During
fire

After fire 
(short-term)

After fire
(mid-term)

After fire
(long-term)

Field skills

Low

Medium

Hard

Lab skills

Low

Medium

Hard

Material cost

Low

Medium

Hard

Time cost

Low

Medium

Hard

Calculation expertise

Low

Medium

Hard
Equipment

  • 1-2 square frames1 of 1-2 m2

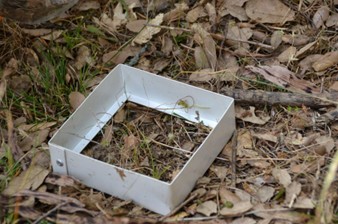
  • 1-2 square frames1 of 0.15 x 0.15 m

  • Clear plastic ruler to measure duff and litter depths 

  • Tools for collecting duff and litter (e.g. garden trowel)

  • Paper bags and ties for collecting samples

  • Lab balance (precision: 0.1g)

  • Lab oven

1 The size of the frame may vary depending on the size of the leaves. Additionally, in the case of a dense shrub understorey, it may be necessary to cut the aerial part of the shrubs before placing the frames.

Experimental design

At least four plots for a homogeneous study area (e.g. conifer forest, mixed forest, shrubland, broadleaves forest), and at least 4 sub-plots inside each plot. Each plot should be marked adequately with markers and labels, or coordinates recorded with a GPS for future samplings.

Methodology

  1. Identify number and localization of the sampling plots: set a central point and mark the coordinates of the point 
  2. Trace two transects of 30 m length directed North-South and East-West, intersecting the central point.
  3. Use the two end points of each transect as the center of a 1-2 m2 plot.
  4. Divide the plot into four quadrants (sub-plots) with sides measuring 0.5/1.0 meter and place randomly a 0.15 × 0.15 m frame1 inside each one of the four subplots.
  5. Inside each 0.15 × 0.15 m frame, measure the litter depth with a clear plastic ruler.
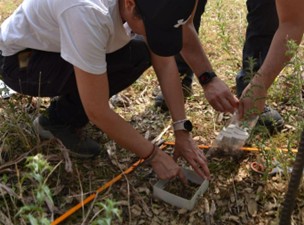
  6. Collect all litter material inside the frame and then bring the material collected to the laboratory and dry in an oven at 102 °C for 96 hours.

Calculations

\mathrm{LL_i}(\mathrm{g}\,\mathrm{m}^{-2})= \frac{W_d}{A_{\mathrm{frame}}}

\begin{array}{l} \textbf{Where:} \\[0.5em] \mathrm{LL_i} = \text{Litter load of frame i} \\ W_d = \text{Dry weight (g)} \\ A_{\mathrm{frame}}= \text{Frame area}\ (\mathrm{m}^{2}) \\ \end{array}
\mathrm{\overline{LL}}(\mathrm{g}\,\mathrm{m}^{-2})= \frac{\sum_{i=1}^{n} LL_i}{n}
\begin{array}{l} \textbf{Where:} \\[0.5em] \mathrm{\bar{LL}} = \text{Average litter load of the plot} \\ LL_i = \text{Litter load of frame i} \\  n = \text{Number of sampling frames} \end{array}

\mathrm{BD}(\mathrm{g}\,\mathrm{cm}^{-3})= \frac{LL_i}{\overline{LD}\times A_{\mathrm{frame}}}

\begin{array}{l} \textbf{Where:} \\[0.5em] \mathrm{BD} = \text{Bulk density} \\ LL_i = \text{Litter load of frame i} \\ \overline{LD} = \text{Average litter depth (cm)} \\A_{\mathrm{frame}}= \text{Frame area}\ (\mathrm{cm}^{2}) \\ \end{array}

Relation with other methods

NA

Illustrations

Fig. 1. A frame of 0.15 x 0.15 m
Fig. 2. Litter collection

Data templates

NA