Skip to content

Point sampling for non-destructive assessment of fuel structure and load

Fernades, P.M.1

1Centro de Investigação e Tecnologias Agroambientais e Biológicas, Universidade de Trás-os-Montes e Alto Douro

Last updated: 25/09/2026

Recommended citation:

Fernandes, P.M. 2026. Point sampling for non-destructive assessment of fuel structure and load. In: Pere Casals, Davide Ascoli, Lena Vilà-Vilardell, Imma Oliveras, Madoka Krick (eds.) 2026. Methods handbook for characterizing fire use behavior, assessing fire effects, and monitoring soil and vegetation responses at the stand level. FIRE-ADAPT project (number 101086416), deliverable D1.1

Indicator

Fuel load: Canopy fuel load

Brief introduction

Describing surface fuel structure and quantifying fuel load per fuel layer (duff, litter, non-woody vegetation, shrubs) within field inventories is of paramount importance to be able to classify fuel hazard, estimate potential fire behaviour, and assess fire effects, and should be carried out in the frame of prescribed-burning best practices. Non-destructive methods are well suited for fire management purposes but are also often used by researchers. The assessment of vegetation composition, cover and height is usually based in line-interception techniques along transects. However, point sampling can be an effective and less time-consuming alternative, namely when fuel inventory needs to be accomplished across multiple plots and locations, and can be useful to document the effects of management and post-treatment dynamics1.

1 The method is not adequate to assess downed dead woody fuels and scattered/discontinuous grassy fuels.

Method specifications

Method type

Soft

Hard

Method timing

Before
fire

During
fire

After fire 
(short-term)

After fire
(mid-term)

After fire
(long-term)

Field skills

Low

Medium

Hard

Lab skills

Low

Medium

Hard

Material cost

Low

Medium

Hard

Time cost

Low

Medium

Hard

Calculation expertise

Low

Medium

Hard
Equipment

  • 2-m height pole (graduated in cm)

  • Ruler

  • Tape measure

  • Compass

  • GPS

  • Paint

Experimental design

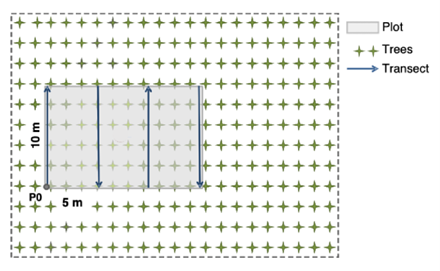
Here we focus on the approach of Mirra et al. (2017) in a context of plantation forestry, but the method is of general application for forests, woodlands and shrublands. Four parallel 10-m long transects are layed out at distances of 5 m, defining a 150-m2 (10 x15 m) plot. On each transect, fuels are described at 1-m intervals, with the transect extremities defined as the first and last sampling point, hence n=11 per transect and n=44 per plot. The 1-m point sampling distance was adopted to adequately capture the expected gradient in fuel structure and load between rows and inter-rows. However, point sampling is highly flexible and can be adapted to different inventory schemes, e.g. Mihajlovski et al. (2023) assessed fuels at 33 points along four diagonal transects at 45 degrees to each other (8 points per diagonal, plus the plot center) within 500-m2 circular plots.

If monitoring is involved, each plot needs to be marked permanently on-site or its GPS coordinates need to be registered.

Methodology

  1. Plot location coordinates (P0 in the sampling scheme figure) are geo-located and the nearest tree is painted with a red mark for future reference.
  2. The field crew (two people) move along each transect and collect the required data at each sampling point.
  3. A 2-m tall pole graduated in cm is placed perpendicular to the ground at each sampling point.
  4. The presence/absence and height (to the nearest cm) of the following vegetation categories are recorded at each point: shrubs; ferns, herbs and other non-woody understory species; litter, preferably distinguishing between the L and F horizons.
  5. Additionally, the shrub species or genus is registered and, optionally, a visual estimate of its live fuel percentage (to the nearest 10%).

Calculations

Fuel measurements are averaged for the plot, e.g mean understory percent cover – from the frequency of recorded presences – and height, phytovolume, litter cover and litter depth. These metrics are then combined with bulk densities (kg m-3) or with equations adequate for stand-level estimation to derive the respective fuel loads (t ha–1).

Relation with other methods

This method can be supplemented with other fuel load estimation methods, such as Destructive sampling and Belt transects.

Illustrations

Sampling scheme of the method applied to a forest plantation where trees are in rows. Sampling is initiated at P0 and the arrows indicate the sampling sequence.

Data templates

NA

Further information

Mihajlovski, B., Fernandes, P.M., Pereira, J.M.C., Hernández, J.G. 2023. Comparing forest understory fuel classification in Portugal using discrete ALS data and satellite multi-source remote sensing data. Fire 6: 327. 

Mirra, I., Oliveira, T., Barros, A.M., Fernandes, P.M. 2017. Fuel dynamics following fire hazard reduction treatments in blue gum (Eucalyptus globulus) plantations in Portugal. Forest Ecology and Management 398: 185–195.