Skip to content

Visual obstruction for fuel structure estimation

Casals, P.1; Vilà-Vilardell, L.1 

1Forest Science and Technology Centre of Catalonia (CTFC)

Last updated: 28/09/2026

Recommended citation:

Casals, P. & Vilà-Vilardell, L. 2026. Visual obstruction for fuel structure estimation. In: Pere Casals, Davide Ascoli, Lena Vilà-Vilardell, Imma Oliveras, Madoka Krick (eds.) 2026. Methods handbook for characterizing fire use behavior, assessing fire effects, and monitoring soil and vegetation responses at the stand level. FIRE-ADAPT project (number 101086416), deliverable D1.1

Indicator

Fuel load: Surface fuel load

Brief introduction

This is a non-destructive indirect method to estimate the surface vegetation structure, volume or biomass. This method is especially useful for comparing changes in fuel structure before and over-time after fire in permanent transects. 

When compared over time, it is possible to compare changes in visual obstruction in different strata (e.g., 0-0.5 m, 0.5 – 1.0 m, 1.0 – 2.0 m).

Method specifications

Method type

Soft

Hard

Method timing

Before
fire

During
fire

After fire 
(short-term)

After fire
(mid-term)

After fire
(long-term)

Field skills

Low

Medium

Hard

Lab skills

Low

Medium

Hard

Material cost

Low

Medium

Hard

Time cost

Low

Medium

Hard

Calculation expertise

Low

Medium

Hard
Equipment

  • Tape measure (20 m) for the transect

  • A cover pole divided in several bands1. Each band is identified with a number or letter.

  • A 1.50 -1.70 m sighting pole to maintain a constant observation height

  • A data form to record vegetation structure

  • Pencils (digital camera optional)

Experimental design

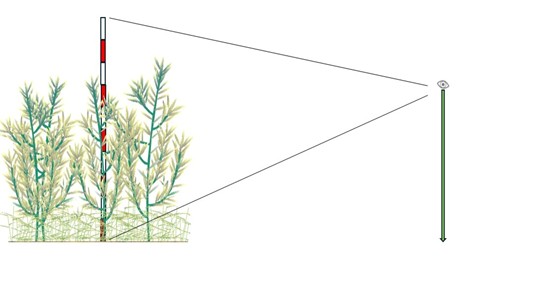
The method consists of recording visual obstruction of bands on a cover pole from a constant distance and height of observation1. This is done along a transect and at a constant distance from the pole (Figure 1). A sighting pole is used to maintain constant observation height (Figure 2). The length of the transect and the distance between the positions depends on the density of vegetation, since it is necessary to be able to see the cover pole from the sighting pole.  

A band is considered covered by vegetation if at least 25% of the band is visually obstructed by vegetation.

1 The number and size of the bands depends on the structure of the vegetation. A typical cover pole is a 2 m with bands of 10 or 20 cm.

Methodology

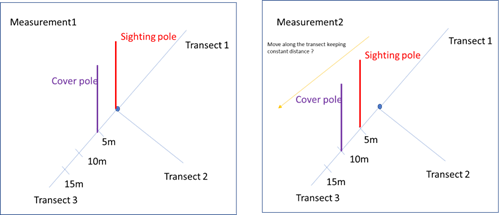
  1. From the plot center, distribute 3 transects (for instance, 20 m each) and 3 positions per transect (for instance, at 5, 10, 15 m) (Figure 1). Place the cover pole on the first position of the first transect and the observer with the sighting pole in the center (Figure 1). 
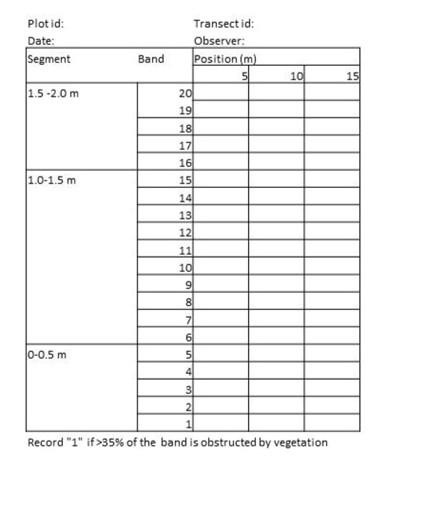
  2. For each identified band, record whether or not at least 25% of the band is visually obstructed by vegetation. Start recording the bands from the top in the data form (Figure 3).
  3. Move the cover pole to the next position in the transect. The observer with the sighting pole stands at a constant distance from the cover pole (for instance 5 m if each transect is divided in 5 m segments).

Calculations

Calculate the visual obstruction for each position:

\mathrm{VO}(\%)= \frac{\text{nº bands obstructed}}{\text{Total number of bands}}

\begin{array}{l} \textbf{Where:} \\[0.5em] \mathrm{VO} = \text{Visual obstruction}  \end{array}

Then calculate the average visual obstruction of the plot.

Relation with other methods

Visual obstruction can be combined with Photo point series or visual volume estimation methods.

Illustrations

Figure 1. Scheme showing the three transects and the position of the cover and sighting poles at the first and second measurements.
Figure 2. Example of a cover (2 m, with red and white bands) and sighting (1.7 m) poles.
Figure 3. Example of data form for a 3 positions per transect and a cover pole of 2.0 m with five bands per segment (modified from Herrick et al. 2009).

Data templates

NA

Further information

Herrick J, Van Zee JW, Havstad KM, Burkett M, Whitford WG. 2009. Monitoring manual for grassland, shrubland, savanna ecosystems. Volume II. Design, supplementary methods, and interpretation. USDA-ARS Jornada Experimental Range. New Mexico. ISBN 0-9755552-0-0