Skip to content

Visual soil burn severity classification

Fernández, C. 1

1 Misión Biológica de Galicia. Consejo Superior de Investigaciones Científicas 

Last updated: 28/09/2026

Recommended citation:

Fernández, C. 2026. Visual soil burn severity classification. In: Pere Casals, Davide Ascoli, Lena Vilà-Vilardell, Imma Oliveras, Madoka Krick (eds.) 2026. Methods handbook for characterizing fire use behavior, assessing fire effects, and monitoring soil and vegetation responses at the stand level. FIRE-ADAPT project (number 101086416), deliverable D1.1

Indicator

Fire severity: Severity on soil

Brief introduction

Assessing soil burn severity -defined as the degree of change caused by fire- is an urgent and critical step in prioritizing areas to propose post-fire soil stabilization activities.

The effects of fire on the soil are categorized based on the following indicators:  changes in the organic soil cover (degree of consumption),changes in the mineral soil surface (changes in colour or structure) and deposition of ash resulting from the combustion of biomass or from the soil itself. The classification system was developed by Fernández and Vega (2016). It facilitates the identification of the different levels of soil burn severity in forested areas and the correlation between these visual assessments and changes in a series of soil properties and post-fire soil erosion. 

Method specifications

Method type

Soft

Hard

Method timing

Before
fire

During
fire

After fire 
(short-term)

After fire
(mid-term)

After fire
(long-term)

Field skills

Low

Medium

Hard

Lab skills

Low

Medium

Hard

Material cost

Low

Medium

Hard

Time cost

Low

Medium

Hard

Calculation expertise

Low

Medium

Hard

Equipment

  • 1-2 square frames of ca. 25-30 cm diameter1 .
  • A tape and spatula to record soil depth
  • A 40 m measuring tape
  • GPS
  • stakes
  • paper, pens, and portfolios

Experimental design

To design on-site sampling within the context of an emergency scenario, the area to be sampled must be defined according to criteria related to vulnerability to post-fire risks (Vega et al., 2013) . Given the urgency of the actions to be taken to mitigate hydrological and erosion risks, it is preferable to focus all on-site inventory efforts on the areas that are potentially most vulnerable. Stratified sampling is used to provide greater accuracy in estimates, increasing plot density in the areas that are potentially most significant (in terms of identifying the assets at risk). Therefore, areas with high rockiness (> 50%) and areas with a slope < 20% where the risk of erosion is lower are not a priority.  Potentially, the most vulnerable areas are shrublands and forests that have experienced crown fires, since they are not protected by fallen leaves from the burned tree crowns, and erosion depends solely on soil burn severity (Fernández et al., 2020).

Once the sampling area and the number of sampling points have been determined, the sample will be collected systematically in situ, using a geometric pattern of a square grid.

Methodology

  1. Plot setup: After locating the center of the plot using a GPS device, two 40-meter-long transects will be established, with their midpoint coinciding with the center of the plot. One of the transects will be established with a random direction, and the other will be perpendicular to the first. These transects will be marked using stakes and a measuring tape.
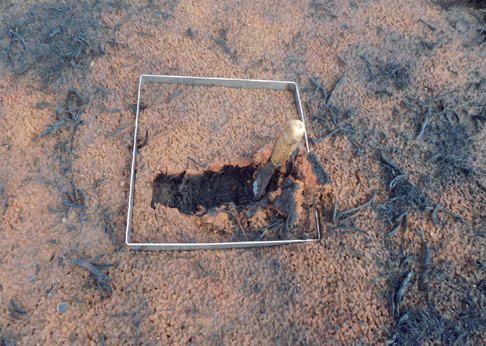
  2. Soil burn severity assessment: A 30 x 30 cm square is placed on each transect every 2 meters to determine the dominant value of the visual indicators of soil burn severity.


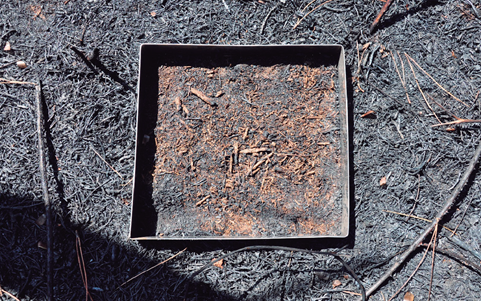
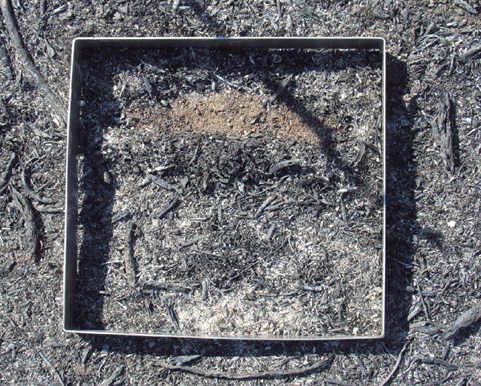
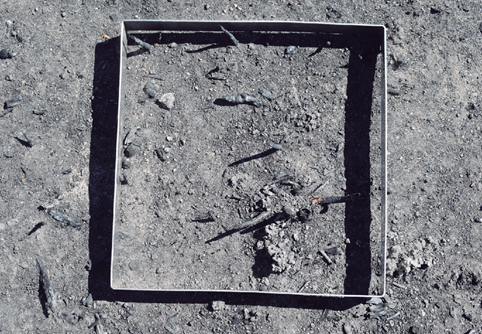
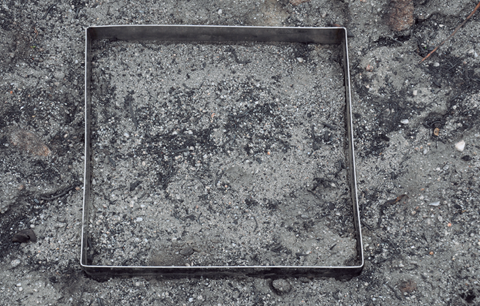
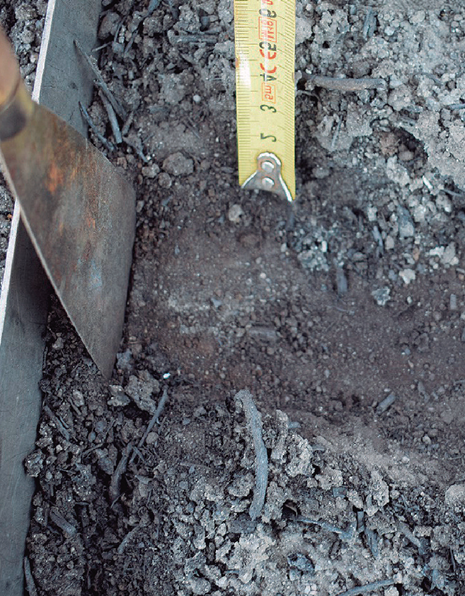
The visual indicators  are described as follows (see figure): 

  1. Burnt litter layer (Oi layer)1 but limited duff (Oe + Oa layers1) consumption; 
  2. Oa layer1 totally charred and covering mineral soil, possibly some ash deposition; 
  3. soil organic layer (Oi + Oe + Oa) completely consumed (bare soil) but soil organic matter not consumed and surface soil intact, some ash deposition; 
  4. Soil organic layer completely consumed, soil organic matter in the Ah horizon partially consumed and soil structure altered within a soil thickness less than 1 cm, noticeable ash deposition; 
  5. as 4, but with the thickness of affected soil equal to or more than 1 cm; 
  6. as 4 or 5 and colour altered (reddish).

1 Oi (or L layer): top layer of fresh, and relatively undecomposed material like whole leaves, needles, twigs, and bark, Oe (or F layer) (the middle transitional layer containing moderately decomposed and fragmented organic matter), Oa (or H layer): The bottom layer composed of highly decomposed, amorphous organic matter (humus), Ah (top layer of mineral soil)

Calculations

The plot soil burn severity is determined by calculating the average or the recorded values.

Relation with other methods

NA

Illustrations

Level 1
Level 2
Level 3
Level 4
Level 5
Level 6

Data templates

NA

Further information

Fernández, C.; Vega, J.A. 2016. Modelling the effect of soil burn severity on soil erosion at hillslope scale in the first year following wildfire in NW Spain. Earth Surface Processes and Landforms.41 (7): 928-935.

Fernández, C.; Vega, J.A.; Fontúrbel, T. 2020 .Comparison of the effectiveness of needle cast and straw helimulching for reducing soil erosion after wildfire in NW Spain. Journal of Soil and Sediments. 20:535-541

Fernández, C.; Fernández-Alonso, J.M.; Keizer, J.J.; Girona-García, A. 2021. Guía para la evaluación de campo de la severidad del fuego en el suelo. ISBN: 978-84-124269-3-9. 40 pp.

Vega, J. A. ; Fontúrbel T.; Fernández,  C. ; Arellano. A.; Díaz-Raviña, M.; Carballas, T.; Jiménez, Á.; , Gonzáez-Prieto, S. J.., Merino, A.; Benito, E. 2013. Acciones urgentes contra la erosión en áreas forestales quemadas. Guía para su planificación en Galicia. ISBN: 978-84-8408-716-8. 139 pp.