Skip to content

Surface fire rate of spread

Ascoli, D.1

1DISAFA, University of Torino

Last updated: 28/09/2026

Recommended citation:

Ascoli, D. 2026. Surface fire rate of spread. In: Pere Casals, Davide Ascoli, Lena Vilà-Vilardell, Imma Oliveras, Madoka Krick (eds.) 2026. Methods handbook for characterizing fire use behavior, assessing fire effects, and monitoring soil and vegetation responses at the stand level. FIRE-ADAPT project (number 101086416), deliverable D1.1

Indicator

Fire intensity: Rate of spread

Brief introduction

Rate of spread (ROS) is a key descriptor of surface fire behaviour because it controls fire growth and,  together with flame dimensions and fuel consumption, drives fire intensity and potential effects. Fire  behaviour and ROS are strongly influenced by fuel properties, weather (especially wind speed and  direction), and topography, which interactions make fire spread highly variable in space and time. In  experimental burns, ROS is commonly estimated by timing the advance of the fire front across pre-set  markers at fixed distances. However, linear arrays of points implicitly assume a spread direction parallel to  the line connecting points, an assumption that can be violated when wind shifts or fuels are patchy. To cope  with within-burn heterogeneity and variable spread direction, Simard et al. (1984) proposed estimating ROS  from the times of fire arrival at the vertices of a triangle, providing an average spread rate that is  independent of the instantaneous direction of fire propagation.

Method specifications

Method type

Soft

Hard

Method timing

Before
fire

During
fire

After fire 
(short-term)

After fire
(mid-term)

After fire
(long-term)

Field skills

Low

Medium

Hard

Lab skills

Low

Medium

Hard

Material cost

Low

Medium

Hard

Time cost

Low

Medium

Hard

Calculation expertise

Low

Medium

Hard
Equipment

  • Measuring tape, rods and flags to lay out triangles and label vertices

  • Datalogging timers connected to thermocouples

  • Thermocouple extension wires (≈ 1 m) and connectors (0.4 mm in Ø) 

  • Batteries and synchronisation software for simultaneous start/reset 

  • Small hand tools to bury meters (trowel) and protect data loggers 

  • Field notebook: data sheets for triangle geometry (b, c, A) and sensor IDs

Experimental design

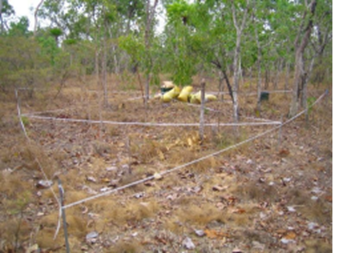
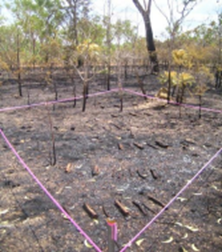
Equilateral triangles are established within the experimental burn plot to define microplots (Fernandes et al.  2000, Smith et al. 1991) for fire behaviour assessment. Example: triangles 5 m sides (microplot scale), and  additional larger equilateral triangles (20 m sides) can be used to estimate plot-scale ROS (see image). A  thermocouple is installed at each vertex. Before ignition, all dataloggers are buried in the soil with only the  thermocouple junction exposed above the surface in the expected fire path. Timers are synchronised.

Methodology

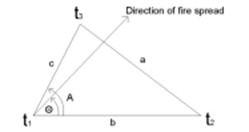
  1. Lay out each triangle and label the three vertices. Record the base side length b (between vertices 1 and 2), the  adjacent side length c, and the included angle A (for equilateral triangles: b = c = side length; A = 60°). 
  2. Install one thermocouple at each vertex: bury the datalogger, leave the thermocouple junction exposed  above the ground, and ensure it is in contact with the flame front as it passes. 
  3. Synchronise and start all dataloggers before ignition. 
  4. After the fire passes, retrieve meters and download the time of fire arrival at each vertex (t1, t2, t3) based  on a predefined temperature threshold (e.g., 200 °C). 
  5. Compute ROS for each triangle using the Simard procedure (see calculations below) and summarise  results as mean ROS per triangle (microplot) and/or per plot (average ROS among triangles).

Calculations

To estimate the direction of spread relative to the base line (Θ) and the rate of spread (ROS) within the  triangle (Simard et al. 1984)1.

\Theta = \tan^{-1}\left[ \left(\frac{t_3-t_2}{t_2-t_1}\right) \left(\frac{b}{c\sin A}\right) -\frac{1}{\tan A} \right]

\begin{array}{l} \textbf{Where:} \\[0.5em] \Theta = \text{Angle (º) of spread relative to the base line between vertices 1 and 2} \\ t1, t2, t3 = \text{Times when the fire front arrives at the first, second, and third vertices of the triangle (s)} \\ b = \text{Length of the base side from which } \Theta \text{ is measured (m)} \\ c = \text{Length of the side which forms, with } b, \text{ the angle } A \\ A = \text{Angle formed by } b \text{ and } c \text{ (º)} \end{array}
ROS \, (\mathrm{m\,s^{-1}}) = \frac{b\cos\Theta}{t_2-t_1}
\begin{array}{l} \textbf{Where:} \\[0.5em] \mathrm{ROS} = \text{Rate of spread} \\ b = \text{Length of the base side from which } \Theta \text{ is measured (m)} \\ \Theta = \text{Angle (º) of spread relative to the base line between vertices 1 and 2} \\ t1, t2 = \text{Times when the fire front arrives at the first and second vertices of the triangle (s)}  \end{array}

1 For equilateral triangles, A = 60° and b = c, simplifying field measurements. ROS represents an average spread rate across the  triangle area, and accuracy decreases if the fire front is strongly fragmented at the scale of the triangle or if one vertex sensor fails.

Relation with other methods

This triangle-based timing approach provides ROS estimates that are not constrained by a priori  assumptions about fire spread direction. ROS can be used to estimate fireline intensity. Since thermocouples allow calculating time above a threshold temperature, the same setup can be used to estimate flame  residence time at fixed points, supporting integrated characterisation of fire behaviour (e.g., coupling ROS  with intensity metrics). Inside the triangle ecological effects can be measured for correlation studies.

Illustrations

Graphic representation of the fire spread vertices
Triangle layout before fire
Triangle layout after fire

Data templates

NA

Further information

Fernandes P., Catchpole W.R., Rego F.C., 2000b. Shrubland Fire Behaviour Modelling with Microplot Data. Canadian  Journal Forest Research 30: 889-899. 

Simard, A.J., Eenigenburg, J.E., Adams, K.B., Nissen, R.L., & Deacon, A.G. (1984). A general procedure for sampling  and analysing wildland fire spread. Forest Science, 30(1), 51–64. 

Smith J.K., Laven R.D., Omi P.N., 1993. Microplot sampling of fire behavior on Populus tremuloides stand in North central Colorado. International Journal of Wildland Fire 3(2): 85-94.