Skip to content

Ashes color

Passamani, C.1

1DISAFA – University of Torino

Last updated: 29/09/2026

Recommended citation:

Passamani, C. 2026. Ashes color. In: Pere Casals, Davide Ascoli, Lena Vilà-Vilardell, Imma Oliveras, Madoka Krick (eds.) 2026. Methods handbook for characterizing fire use behavior, assessing fire effects, and monitoring soil and vegetation responses at the stand level. FIRE-ADAPT project (number 101086416), deliverable D1.1

Indicator

Fire severity: Severity on soil

Brief introduction

Fire severity is an important indirect measure of fire effects on vegetation and soil properties, and more generally on ecosystems. Fire-induced changes in soil and ground-surface properties may affect infiltration, runoff and erosion potential. Visual indicators of soil burn severity are defined on the basis of immediate changes (observed in the fields) in the forest floor and mineral soil, together with ash deposition. The presence of ash is one of the key characteristics of burned areas. Ash is a particulate residue derived from the combustion of surface biomass or aboveground vegetation deposited on the ground; it consists of mineral materials and charred organic components. Ash color is indicative of soil heating and reflects the completeness of combustion. The lighter the ash, the more complete the combustion and the higher the temperatures reached. Ash color can be used as an indicator of organic-matter consumption, and as an indirect estimator of fire severity. Brownish colors represent low fire severity, black to very dark gray moderate fire severity and dark gray to white ash, high fire severity. The present method is based on the visual attribution of a burn severity class, according to ash color. It is a ground-based approach, easy to apply as an operational tool, used to assess the level of burn severity after both prescribed burning and wildfire.

Method specifications

Method type

Soft

Hard

Method timing

Before
fire

During
fire

After fire 
(short-term)

After fire
(mid-term)

After fire
(long-term)

Field skills

Low

Medium

Hard

Lab skills

Low

Medium

Hard

Material cost

Low

Medium

Hard

Time cost

Low

Medium

Hard

Calculation expertise

Low

Medium

Hard

Equipment

  • 30 x 30 cm sampling square

  • Measuring wheel

Experimental design

The experiment has to be carried out immediately after the fire (between 1 and 3 days after the fire and before the first rainfall event). On the basis of the extent of burned area define an adequate number of plots, sufficient to characterize the site. At each plot, locate a randomly oriented transect of 150 m length. Each 5 meters, identify a point where to locate a square of 30 cm edge, adjacent to the transect. Each plot can be marked adequately, or coordinates can be recorded with a sub-metric GPS for future samplings.

Methodology

  1. At each 5 meters point of the transect materialize a square.
  2. Looking at the square, assign a burn severity class representing the mean condition inside the square.
  3. The burn severity class has to be assigned based on the ash color, and it is expressed as a numerical value representing the following conditions:
  • 0: Unburned – No changes in soil
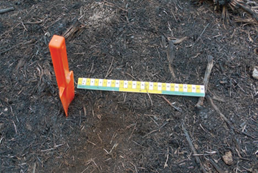
  • 1: Low severity – Ground surface may be black with recognizable fine fuels (needles, grass, and leaves) remaining on the surface (Fig. 1).
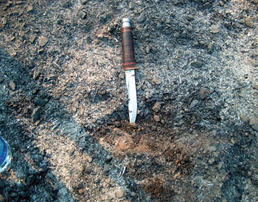
  • 2: Medium severity – Thin layer of black to gray ash with recognizable litter beneath it. Ash layer may be patchy as it is highly moveable by wind and water. Soil heating may have been significant; residence time usually brief (Fig. 2).
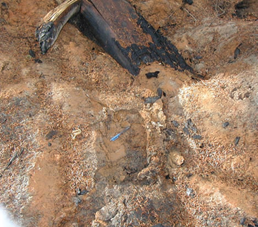
  • 3: High severity – Thick layer of powdery gray or white ash covers the ground. Greater than 90% surface organics consumed; significant soil heating has occurred; residence time long. No potential for leaf- or needle-cast to provide ground cover. Localized red (oxidized) soil may underlie a thick, powdery layer of gray and white ash–generally found near a burned out stump or log; indicates extreme heating (Fig. 3).

Calculations

For each plot, compute the mean value of the soil burn severity as the average of the soil severity numerical levels observed weighted by the percentage presence of the above soil burn severity levels in the transects.

Relation with other methods

This method can be combined with other methods to assess the burn severity.

Illustrations

Figure 1
Figure 2
Figure 3

Data templates

NA

Further information

Fernández, C., & Vega, J. A. (2016). Modelling the effect of soil burn severity on soil erosion at hillslope scale in the first year following wildfire in NW Spain. Earth Surface Processes and Landforms, 41(7), 928–935

Parsons, A., Robichaud, P. R., Lewis, S. A., Napper, C., & Clark, J. T. (2010). Field guide for mapping post-fire soil burn severity (Gen. Tech. Rep. RMRS-GTR-243). U.S. Department of Agriculture, Forest Service, Rocky Mountain Research Station.

Vega, J. A., Fontúrbel, T., Merino, A., Fernández, C., Ferreiro, A., & Jiménez, E. (2013). Testing the ability of visual indicators of soil burn severity to reflect changes in soil chemical and microbial properties in pine forests and shrubland. Plant and Soil, 369(1–2), 73–91.