Skip to content

Destructive measurements of live shrub fuel load

Pellizzaro, G.1, Bacciu, V.1, Scarpa, C.1

1National Research Council of Italy – Institute for the BioEconomy

Last updated: 25/09/2026

Recommended citation:

Pellizzaro, G., Bacciu, V. & Scarpa, C. 2026. Destructive measurements of live shrub fuel load. In: Pere Casals, Davide Ascoli, Lena Vilà-Vilardell, Imma Oliveras, Madoka Krick (eds.) 2026. Methods handbook for characterizing fire use behavior, assessing fire effects, and monitoring soil and vegetation responses at the stand level. FIRE-ADAPT project (number 101086416), deliverable D1.1

Indicator

Fuel load: Surface fuel load

Brief introduction

The fuel load represents the amount of fuel available for combustion, influencing the potential energy a fire can release. It is measured in terms of dry weight per unit area. 

Vegetation fuel is composed of various types and structures of vegetation, including herbs and shrubs. Fire behavior and characteristics can vary in relation to vegetative fuel conditions, such as dead or live fuel. Live fuel is a major component of the surface fuel in many fire-prone ecosystems, such as the Mediterranean maquis.

Different methods are available to estimate the fuel load, in this case a destructive technique for estimating shrub biomass is described. This approach involves collecting representative fuel samples, drying them in an oven, and then weighing them to determine the dry load.
Method specifications

Method type

Soft

Hard

Method timing

Before
fire

During
fire

After fire 
(short-term)

After fire
(mid-term)

After fire
(long-term)

Field skills

Low

Medium

Hard

Lab skills

Low

Medium

Hard

Material cost

Low

Medium

Hard

Time cost

Low

Medium

Hard

Calculation expertise

Low

Medium

Hard

Equipment

  • 1-2 square frames of 4 m2

  • Paper bags and ties for collecting samples

  • Pruning and garden shears to cut the vegetation

  • Scale for weighing heavy items and/or portable digital dynamometer for field weight measurements

  • A 30 meters tape and a 1 m length pole

  • Lab scale (precision: 0.1g)

  • Lab oven

Experimental design

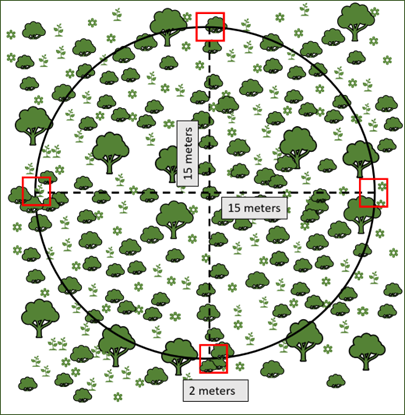
Establish a 15 m circular plot in each homogeneous study area (e.g. conifer forest, mixed forest, shrubland, broadleaves forest). In each circular plot, establish at least 4 destructive subplots inside each plot. Central point of the circular plot should be marked adequately with markers and labels, or coordinates recorded with a GPS for future samplings. The following experimental design was developed as part of the Med-Foreste Interreg project (IT-FR Maritime Program 2014-2020).

Methodology

  1. Set a central point for the 15 m radius circular plot and record the coordinates of the plot center
  2. Establish two 30 m transects oriented North-South and East-West, intersecting at the central point of the plot.
  3. Identify and delimitate the four sub-plots: use the two extremes of each transect as the center of the subplot and place the square frame of 4 m2. 
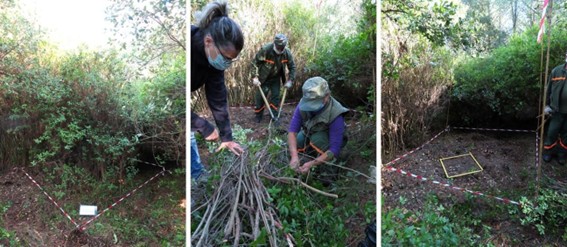
  4. Harvest the live material inside each sub-plot and place the collected material in a labelled envelope.
  5. In the laboratory, weigh the fresh biomass.
  6. Dry the material in an oven at 102 °C for 96 hours (or at 60 °C until a constant weight is reached). After drying, weigh it again to determine the dry mass.
  7. If the amount of live material collected from a subplot in the field is very abundant, take a representative  sub-sample (about 20% of the total weight) and place it in the oven for drying.

Calculations

\mathrm{FL}\,(\mathrm{g}\,\mathrm{m}^{-2}) = \frac{ \mathrm{DW}_{\mathrm{subplot}}}{A_{\mathrm{subplot}}}
\begin{array}{l} \textbf{Where:} \\[0.5em] \mathrm{FL} = \text{Live fuel load} \\ \mathrm{DW}_{\mathrm{subplot}} = \text{Dry weight subplot} \\ \mathrm{A}_{\mathrm{subplot}} = \text{Subplot area} \end{array}

If a sub-sample of the live material from the subplot has been collected:

\mathrm{DW}_{\mathrm{subplot}}\,(\mathrm{g}) = \frac{ WW_{\mathrm{subplot}} \times DW_{\mathrm{subsample}} }{ WW_{\mathrm{subsample}} }

\begin{array}{l} \textbf{Where:} \\[0.5em] \mathrm{DW}_{\mathrm{subplot}} = \text{Dry weight subplot} \\ \mathrm{WW}_{\mathrm{subplot}} = \text{Wet weight subplot} \\ \mathrm{DW}_{\mathrm{subsample}} = \text{Dry weight subsample} \\ \mathrm{WW}_{\mathrm{subsample}} = \text{Wet weight subsample} \end{array}

Then divide the dry weight of the subplot by the total subplot area to obtain the live fuel load per square meter (g m⁻²) as shown in the first equation.

The live fuel load is calculated as the average of the all subplots.

Relation with other methods

NA

Illustrations

Experimental design of the plot (black) and subplot (red)
Subplot before, during and after biomass cutting

Data templates

NA

Further information

Catchpole, W.R. & Wheeler, C.J. (1992). Estimating plant biomass: a review of techniques. Australian Journal of Ecology 17: 121-131.


Foderi et al. (2022). Manuale a supporto delle scelte decisionali in materia di gestione del combustibile per la prevenzione e gestione rischio incendi. Prodotto T1.3.1, Progetto Med-Foreste – “Gestione degli ecosistemi forestali per la riduzione del rischio incendi”, finanziato dal programma di cooperazione transfrontaliera Italia-Francia Marittimo 2014-2020 dell’Unione Europea (https://interreg-maritime.eu/documents/1228604/12503439/MED-FORESTE_Prodotto_T1.3.1_Manuale+a+supporto+delle+scelte+decisionali+in+materia+di+prevenzione+incendi+boschivi.pdf/af2ffa48-b1a4-13e7-cb89-aa5908b07a89?t=1682686048546)