Skip to content

Digital photo series method for surface fuel load estimation

Bacciu, V.1

1National Research Council of Italy – Institute for the BioEconomy

Last updated: 25/09/2026

Recommended citation:

Bacciu, V. 2026. Digital photo series method for surface fuel load estimation. In: Pere Casals, Davide Ascoli, Lena Vilà-Vilardell, Imma Oliveras, Madoka Krick (eds.) 2026. Methods handbook for characterizing fire use behavior, assessing fire effects, and monitoring soil and vegetation responses at the stand level. FIRE-ADAPT project (number 101086416), deliverable D1.1

Indicator

Fuel load: Surface fuel load

Brief introduction

Fuel load estimation is essential for assessing fire hazards, developing fire behaviour predictive models, evaluating the impacts of alternative fuels and treatments to protect lives and ecosystems, and implementing decision support systems for fire management. Numerous sampling methods, protocols, and designs have been developed to quantify fuel loading. Keane (2015) arranged a wide range of techniques from the easiest to the most difficult, considering the uncertainty level. Among these approaches, the visual technique is an indirect method encompassing fuel load quantification through the association of loads by comparing with existing data, visually comparing the fuel condition with other reference conditions. 

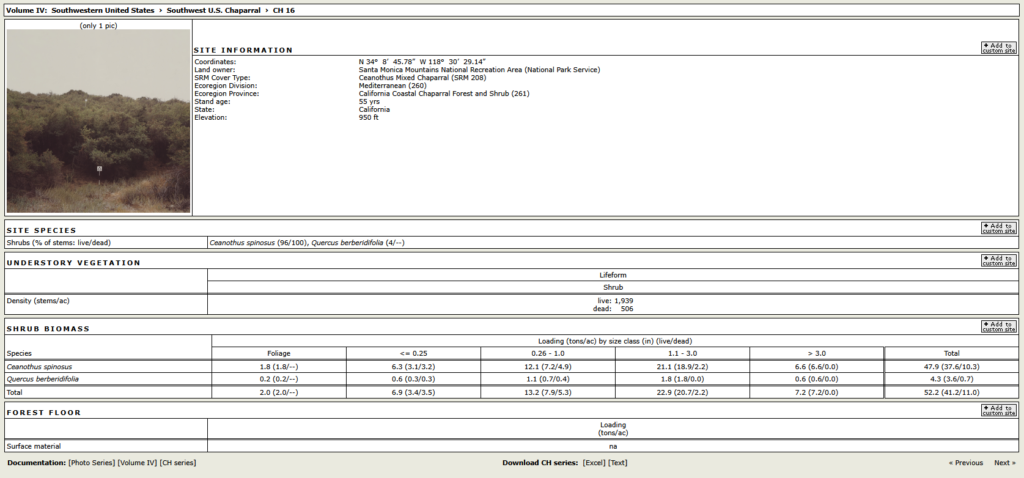
Surface fuel loading is visually estimated using a set of pictures representing average stand conditions for different vegetation types. When developing the digital photo series (DPS) (https://research.fs.usda.gov/pnw/projects/digitalphotoseries), fuel component loadings are measured, and the summary of the loadings is reported next to the picture (Fig. 1). For years, fire managers in the United States have used photographs of fuel complexes as decision-making and training aids.

Despite the clear advantages of using this technique, we must be conscious that fuel load estimation using photo series is often inaccurate and difficult to repeat across observers and vegetation types (Sikkink and Keane, 2008). Some fine fuel components, such as 1hr dead woody fuel, litter, or duff, can be hidden by the vegetation in the pictures; thus, underestimating these components is quite frequent.
Method specifications

Method type

Soft

Hard

Method timing

Before
fire

During
fire

After fire 
(short-term)

After fire
(mid-term)

After fire
(long-term)

Field skills

Low

Medium

Hard

Lab skills

Low

Medium

Hard

Material cost

Low

Medium

Hard

Time cost

Low

Medium

Hard

Calculation expertise

Low

Medium

Hard

Equipment

https://research.fs.usda.gov/pnw/projects/digitalphotoseries 

  • 1-2 square frames of 4 m2

  • Paper bags and ties for collecting samples

  • Pruning and garden shears to cut the vegetation

  • Scale for weighing heavy items and/or portable digital dynamometer for field weight measurements

  • A 30 meters measuring tape and a rigid meter

  • Lab balance (precision: 0.1g)

  • Lab Oven

Experimental design

The most effective way to transfer DPS to non-US contexts is to treat them as a tool for structural fuel analogy (not as “same ecosystem = same numbers”) and then link them to local calibration data.

Methodology

  1. Define the operational goal (e.g., fuel load or inputs for fire behavior models?). This determines whether your use is mainly quantitative (numbers) or comparative/diagnostic (classes and patterns).
  2. Build a “crosswalk” (equivalence table). For each DPS, (i) extract the main fuel structure elements (canopy cover, understory density, litter layer, coarse woody debris, ladder fuels); (ii) identify local vegetation/fuel types that are structurally similar (using local classification systems such as CORINE, regional forest typologies, or management categories). The aim is not to match species, but to match the architecture of fuels (how fuels are arranged and connected).
  3. Collect a minimal but strategic local calibration dataset. Select a limited number of representative sites (5–10 sites per main fuel/vegetation type) covering gradients of stand density, understory development, and management/disturbance. At each site, collect: standardised field photos (same viewpoints and reference scales), rapid measurements (e.g., fine fuel height, shrub cover),  when feasible, quick transect-based estimates (e.g., downed woody debris) or reliable proxies. The goal is not to replicate the full Photo series project, but to anchor interpretation to local conditions.
  4. Visual scoring + operator consistency checks. Have 2–3 trained operators independently assess the same plots using Photo series, assign the “closest matching photo”, and score fuel attributes (e.g., 1–5 scale). Then evaluate: (i) agreement among operators (repeatability), (ii) systematic biases (e.g., consistent overestimation of shrub fuels due to visual “fullness”).
  5. Quantitative adaptation through local correction factors. If numerical values from Photo series are needed, apply a simple scaling approach: Photo series → locally corrected values (e.g., Photo series suggests “high litter load,” but local measurements show that equivalent Mediterranean litter loads are ~30% lower → apply a correction factor to the Photo series reference values). This produces a localized DPS interpretation layer, improving accuracy for non-US ecosystems.
  6. Produce a hybrid local fuel photo atlas. Create a practical output combining: the original Photo series reference, the most similar local photo(s), notes on key differences (species traits, decomposition rates, seasonality, management), plausible local ranges for fuel loads and continuity indicators.
  7. Validate against real fire or sampling data (if possible). Where data are available, compare: (i) areas classified as high-risk via Photo series analogues and (ii) observed fire behavior patterns (e.g., rapid spread, torching, crown fire initiation). Even a qualitative validation strengthens confidence and highlights where local adjustments are most needed.

Relation with other methods

NA

Illustrations

An example of the Digital Photo Series for the chaparral vegetation type (CH16), from https://depts.washington.edu/nwfire/dps/

Data templates

NA

Further information

Digital Photo Series https://research.fs.usda.gov/pnw/projects/digitalphotoseries 

Keane, R. E. (2015). Wildland fuel fundamentals and applications (Vol. 11904). Cham, Switzerland: Springer International Publishing. 

Sikkink PG, Keane RE. (2008) A comparison of five sampling techniques to estimate surface fuel loading in montane forests*. International Journal of Wildland Fire 17, 363–379. https://doi.org/10.1071/WF07003