Skip to content

Soil basal respiration

Tudela Haberland, G.1; Garcia-Pausas, J.1

1 Forest Science and Technology Centre of Catalonia

Last updated: 24/09/2026

Recommended citation:

Tudela Haberland, G.; Garcia-Pausas, J. 2026. Soil basal respiration. In: Pere Casals, Davide Ascoli, Lena Vilà-Vilardell, Imma Oliveras, Madoka Krick (eds.) 2026. Methods handbook for characterizing fire use behavior, assessing fire effects, and monitoring soil and vegetation responses at the stand level. FIRE-ADAPT project (number 101086416), deliverable D1.1

Indicator

Ecosystem responses: Soil responses

Brief introduction

The method consists of incubating mineral soil samples under standard and optimal conditions, in order to evaluate the loss (in percentage) of total organic carbon in form of CO2.

Method specifications

Method type

Soft

Hard

Method timing

Before
fire

During
fire

After fire 
(short-term)

After fire
(mid-term)

After fire
(long-term)

Field skills

Low

Medium

Hard

Lab skills

Low

Medium

Hard

Material cost

Low

Medium

Hard

Time cost

Low

Medium

Hard

Calculation expertise

Low

Medium

Hard

Equipment

Equipment & Labware


        • Büchner funnel, filter paper, and vacuum/suction pump
        • Glass tins
        • Cylindric metal cores (inner diameter of 5 cm and 5 cm high ≈ 100 cm3)
        • Rubber Mallet Hammer 
        • Plastic Ziploc
        • 2 mm mesh size sieve
        • Air-tight 1L Kilner-type jars
        • 40-50 ml plastic/glass flask for NaOH
        • 100-125 ml plastic/glass flask (plastic specimen container) for the soil sample 
        • Analytical Lab balance (precision: 0.1 mg)
        • Incubator 25°C
        • Drying Oven (105°C)


Reagents & Solutions


        • Deionized water
        • NaOH 0.2 M (0.2 N) 
        • HCl 0.1 M (0.1 N) 
        • Barium chloride (BaCl2) 0.125 M (0.25 N)
        • Indicator 1: Phenolphthalein, 1% in ethanol
        • Indicator 2: Methyl orange

Experimental design

Incubations should run for 30 days, with gas production being measured on Day 3 and weekly thereafter (for instance: Days 3, 10, 17, 24, and 30) to capture the cumulative   CO₂ stabilization curve.

Observations: 

1) The sampling frequency is not firmly established, as it depends on the intensity of soil respiration. If soil respiration is high, the interval between samplings should be reduced. 

2) Incubations should be run in at least triplicate (i.e., three separate incubation vessels per soil sample). Therefore, all listed materials must be multiplied by the total number of replicates, and a sufficient quantity of sieved soil must be prepared to cover all replicates.

Methodology

Field soil sampling procedure:

  1. Push aside the organic surface (litter, leaves, twigs, and duff) to fully expose the underlying mineral soil surface. Exclude all organic layer material from the sample.
  2. Collect 3 mineral soil cores within the cleared area using the 5 cm metal cylinder and hammer, and combine them into a single composite sample for that sampling location.
  3. Label the sample bag clearly and seal the plastic Ziploc bag tightly to prevent moisture loss.
  4. Samples should be stored at 4º C upon arrival from the field until processing.

Note: Remove all soil residue, wipe with alcohol, and dry completely between different sampling plots to prevent cross-contamination. Cleaning is not required between cores taken within the same plot. To save time during field sampling, carry at least two metal cylinders; this allows one core to be cleaned and sanitized while the other is in use.

Laboratory incubation and Analysis procedure:

5. Determine the water-holding capacity (WHC) of the sieved soil sample:

    • Mix 5-10 g of 2 mm sieved soil with deionized water in a plastic container using a spatula until fully saturated.
    • Place the mixture into a Büchner funnel lined with filter paper and apply suction for about 10 minutes until it stops dripping (place filter paper over fritted glass if applicable to avoid clay clogging).
    • Move 2–3 g of drained soil quickly into a tared glass tin and record the wet weight (WW).
    • Dry at 105°C overnight, record the dry mass (DW), and calculate the water volume needed for 60% WHC (refer to Calculation a section)


6. Weigh the field-moist soil sample into a 100–125 mL plastic specimen container.

Note: Base the sample mass on organic matter content. Typically, the amounts follow: ~15 g for the A1 mineral or soil rich in organic matter; ~25 g for a B forest horizon or agricultural mineral soil; and ~40 g (+) for a soil poor in organic matter.

7. For every incubation batch, set up at least 3 blank 1 L jars containing only the 1 cm layer of deionized water and the 10 mL 0.2 M NaOH trap, but without any soil container. These blanks account for ambient background CO₂ during incubation and titration.

8. Add deionized water to reach 60% of the soil’s field capacity (calculated in step 5). Add the water drop by drop across the entire surface to ensure even distribution throughout the sample. Record the final weight.

9. In the 1L air-tight jar: 

        • Add deionized water (a finger-depth).
        • Place the soil sample container (already at 60% of the field capacity). 
        • Put the plastic flask with 10 mL of NaOH 0.2M.

10. Close the jar and place it in an incubator at a constant temperature (25°C), and only take it out at the moment of measurement.

11. After the number of days established per sample, in every 1L jar, the NaOH 0.2 M flasks are replaced by new ones with the same solution (fresh), following this procedure:

        • Open the 1L jar and take the flasks containing the 0.2 M NaOH, and tape them immediately. 
        • Weigh the soil sample and compare it with the initial sample (step 6). If necessary, add more deionized water.
        • Leave the 1L jar open for about 5 minutes to renew the air, and after that, place the flask (soil sample and NaOH solution) inside the jar.

12. Close the jar tightly and place it back in the incubator.

Note: Convenient to check the rubber seal so it’s not dried out and seals properly. Replace if needed.

Laboratory analysis

CO₂ quantification involves back-titration of residual NaOH with 0.1 M HCl after precipitating trapped CO₂ as BaCO₃.

  1. Transfer 10 mL NaOH to a 100 mL Erlenmeyer flask and add 10 mL BaCl₂.
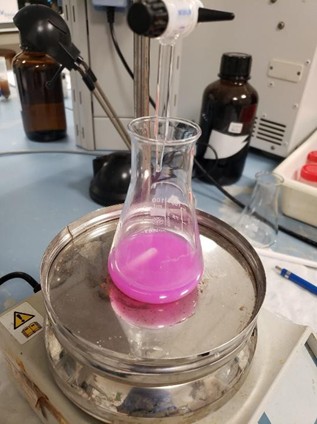
  2. Add 1 drop of phenolphthalein; if the solution does not turn red-purple, discard the sample.
  3. Titrate with 0.1 M HCl until the red color disappears, recording the volume (M).
  4. Repeat steps 13 to 15 for blanks to obtain the average volume (B).
  5. Standardize the HCl by titrating ~100 mg (W) of dried Na₂CO₃ in 25 mL water with 3 drops of methyl orange until the color changes to salmon-pink, recording the volume (V).

Calculate the curves after having the results in the laboratory

Once laboratory results are available and consistent. The calculation should follow the “e” calculation below as suggested by Rovira et al. (2010), in order to have the total cumulative respired C at a certain number of day(s).
Calculations

Procedure

Optimal soil microbial respiration occurs at approximately 60% of Water-Holding Capacity (WHC).

Calculate Soil Water Content at Saturation (WHC) and the water volume required to adjust to 60% WHC (A, in g or mL of H2O per g dry soil):

A= 0.6\times\frac{WW-DW}{DW-Tare}

\begin{array}{l} \textbf{Where:} \\[0.5em] WW = \text{wet weight} \\ DW = \text{dry weight} \\\end{array}

Note: This calculation assumes starting with completely dry soil. Account for existing moisture content if using field-moist soil

Laboratory Analysis

HCl concentration

C_{\mathrm{HCl}}= \frac{\frac{W}{52.995}\times1000}{V}
\begin{array}{l} \textbf{Where:} \\[0.5em] W = \text{ exact weight of Na₂CO₃ used in the titration} \\ 52.995 = \text{equivalent weight of Na₂CO₃} \\V = \text{ volume (mL) used in the evaluation} \\\end{array}

Consumed NaOH (meq)

C_{\mathrm{NaOH}}(\mathrm{meq})= (B-M)\times C_{\mathrm{HCl}}
\begin{array}{l} \textbf{Where:} \\[0.5em] B = \text{average volume consumed by the three blanks} \\ M = \text{volume of HCl consumed by the sample} \\C_{\mathrm{HCl}} = \text{concentration calculated in the previous step.} \\\end{array}

Convert to milligrams of C:

\mathrm{mg\ C}= \mathrm{meq}\times6

Basal soil respiration rate is then calculated by fitting the cumulative respired C in the lab to a double exponential equation:

X_t= X_L\left(1-e^{-k_Lt}\right)+ X_R\left(1-e^{-k_Rt}\right)
\begin{array}{l} \textbf{Where:} \\[0.5em] Xt = \text{total cumulative respired C at time t} \\ X_{\mathrm{L}} = \text{the labile fraction pool} \\X_{\mathrm{R}} = \text{the recalcitrant C pool} \\\end{array}

Relation with other methods

Substrate-induced respiration

Microbial biomass C by chloroform fumigation and extraction

Illustrations

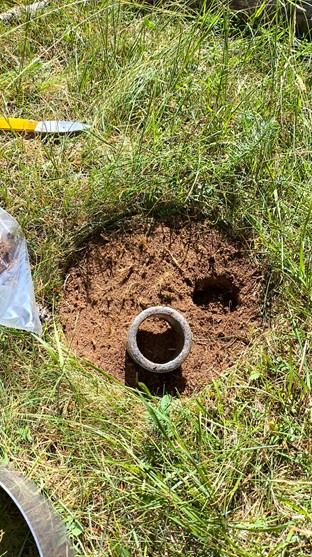
Field sampling of mineral soil. The surface organic layer is set aside, and metal cylinders are placed to collect three replicate samples from the same sampling plot.
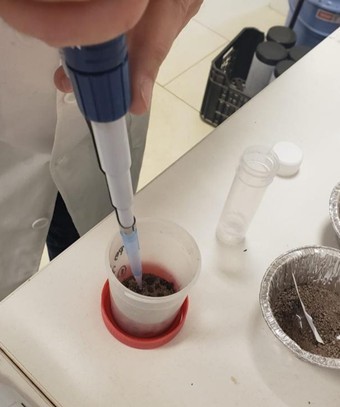
Adding water drops to reach 60% of the field capacity.
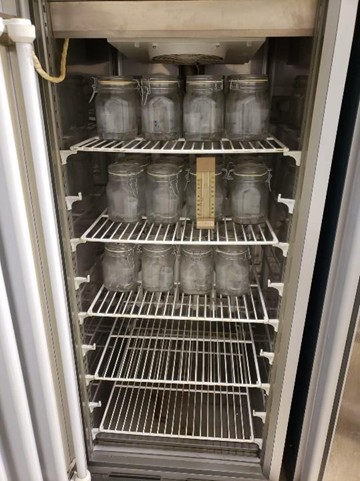
Incubator with the 1L jars containing the sample after moisturizing and the NaOH plastic flask. Note the thermometer to ensure temperature control.
Sample aspect and color after following steps 8 and 9.

Data templates

NA

Further information

Zibilske, L.M., 1994. Carbon mineralization. In: Weaver, R.W., Angle, S., Bottomley, P., Bezdicek, D., Smith, S., Tabatabai, A., Wollum, A. (eds.) Methods of Soil Analysis. Part 2. Microbiological and Biochemical Properties. Soil Science Society of America, Madison, WI. pp. 835–864.

Rovira, P., Jorba, M., Romanyà, J., 2010. Active and passive organic matter fractions in Mediterranean forest soils. Biology and Fertility of Soils. 46, 355-369. https://doi.org/10.1007/s00374-009-0437-0.