Photoload sampling for herbaceous fuel load estimation
Scarpa, C.1, Bacciu, V.1, Pellizzaro, G.1
1National Research Council of Italy – Institute for the BioEconomy
Last updated: 25/09/2026
Recommended citation:
Scarpa, C., Bacciu, V. & Pellizzaro, G. 2026. Photoload sampling for herbaceous fuel load estimation. In: Pere Casals, Davide Ascoli, Lena Vilà-Vilardell, Imma Oliveras, Madoka Krick (eds.) 2026. Methods handbook for characterizing fire use behavior, assessing fire effects, and monitoring soil and vegetation responses at the stand level. FIRE-ADAPT project (number 101086416), deliverable D1.1
Indicator
Fuel load: Surface fuel loading
Brief introduction
At the forest fire scale, the combustion process is affected by several factors, including fuel loading by size classes, the shape and size of fuel components, their compactness, fuel moisture content, and the horizontal and vertical continuity. The fuel load represents the amount of fuel available for combustion and influences the potential energy a fire can release. It is measured in terms of dry weight per unit area.
Fuel loading is essential for assessing fire hazard, developing fire behaviour predictive models, evaluating the impacts of alternative fuels and treatments to protect lives and ecosystems, and implementing decision-support systems for fire management. Measuring surface fuel loadings in the field is challenging because it requires a complex integration of several sampling methods designed for different scales (Keane and Dickinson, 2007).
The photoload sampling technique is a method to quickly and accurately estimate loadings for five common surface fuel components based on Keane and Dickinson (2007) approach.
This method consists of visually comparing fuel conditions in the field with photoload sequences to estimate fuel loadings. The photoload technique specifically identifies five fuel components: 1 hr, 10 hr, 100 hr, and 1000 hr downed dead woody fuels (for more information, please see the method Photoload sampling technique for surface downed dead woody fuel estimation); Shrub: Dead and live shrubby fuels; Herb: Dead and live grass and forb fuels.
Here, we describe the methodology for measuring dead and live grass and forb fuels.
Method specifications
Method type
Soft
Hard
Method timing
Before
fire
During
fire
After fire
(short-term)
After fire
(mid-term)
After fire
(long-term)
Field skills
Low
Medium
Hard
Lab skills
Low
Medium
Hard
Material cost
Low
Medium
Hard
Time cost
Low
Medium
Hard
Calculation expertise
Low
Medium
Hard
Equipment
Plot frame: A square meter plot frame with the square meter area measured on the inside dimensions of the frame.
Clear plastic ruler to estimate herb height. It can also be used to measure duff and litter depths if needed.
4 Double decameters
Stakes and/or pegs and hammer
Photoload procedures and sequences: Photoload sequences laminated to waterproof the pages (Keane and Dickinson, 2007).
Digital camera: Pictures should be taken of the sample site and some microplot conditions for future reference (this is optional equipment, but suggested)
Experimental design
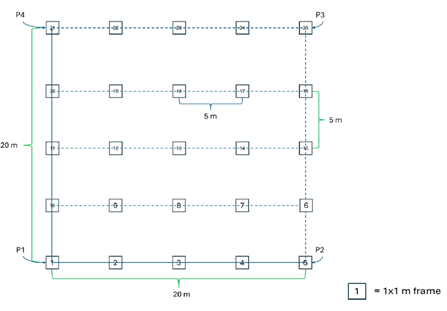
According to Keane and Dickinson (2007), the sampling objective determines the appropriate sampling design. Highly accurate assessments rely on random or systematically stratified networks of 1 m² microplots within a sample unit. Ideally, a 10% sample of the area is recommended: for instance, in a 400 m² macroplot (20 × 20 m), a 10% sample corresponds to 40 m², or 40 microplots. However, practical constraints of time and funding often reduce this percentage. The following experimental design has been designed under the premises of the DRYAD Horizon Europe project (https://dryad-project.eu/). Within several sampling areas, rectangular grids were established for a total of 25 microplots each.
Methodology
- Define the sampling area. Create a rectangular grid established through orthogonal transects, with P1, P2, P3 and P4 as the reference points located at the outer corners of the square
- Establish the main transects. From the vertices P1–P2 and P1–P4, lay out the main transects as guiding lines along the area’s sides (Fig. 1).
- Create the grid. Use the main transects to draw parallel internal lines, which delineate the grid of the sampling points, named micro-plots
- Place the Stakes. Starting from the main reference point, place a stake every 5 meters to create and mark the grid. To ensure a correct alignment of the stakes, use double decameters
- Position the micro-plots. At regular 5-meter intervals, position a 1×1 m frame for each micro-plot within the grid
Estimating herbaceous loading
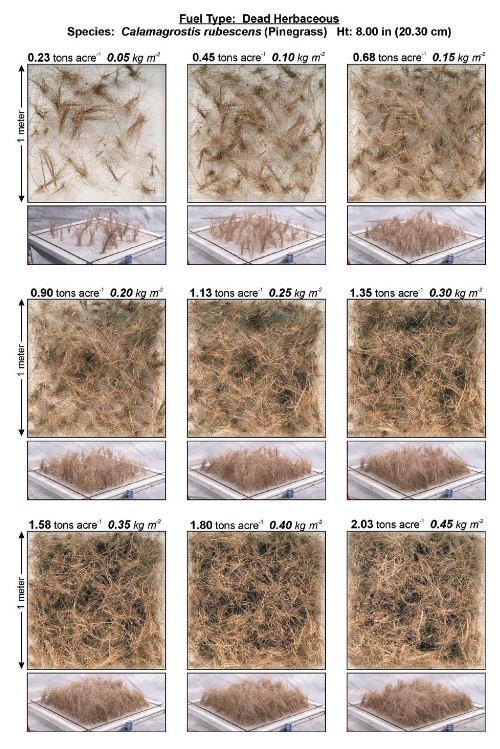
6. For each microplot, the operator first identifies the plant species within the sample unit. The user must estimate loading by matching the group of species occurring in the sample area with one or more of the photoload sequences in Appendix A (Keane and Dickinson, 2007, Figure 2). Take photos of the vegetation inside the 1×1 meter frames.
7. The height of the fuelbed must also be accounted for. This is estimated as an integrated average across the entire sampling area. A hint is to visually drape a sheet over the fuel component and estimate the average height across the entire sheet.
8. The user should try to match the pictures with field conditions based on three characteristics: species, cover, and density. Once a picture is chosen, then the corresponding loading must be adjusted for differences between height in the picture and height in the microplot. The average height of each plant photo series is indicated at the top of each page in the photoload sequences of Appendix A.
9. Since the photoload sequences contain a few number of shrub, grass and forb species, it may be necessary to match the morphology of the species observed in the field with the species presented in the photoload sequences by considering using different photo series, one for each species to be examined, and then summing the individual loadings for a total estimation of shrub and herbaceous component loadings.
10. In the vertices P1–P2 and P1–P4, after the loading estimation within the microplot frame, the operator collects all the material within the plot frame, puts it in a labelled plastic bag, and brings it to the laboratory to dry in the oven at 102 °C for 96 hours. This suggestion is helpful to compare the measured loadings with the ocular estimates so that they can compare their measured loadings with the photoload pictures to calibrate their eye in future field seasons
Calculations
In each microplot, the herb loading is adjusted, in comparison with the load indicated in the picture chosen, proportionally to the ratio between the height indicated in the picture and the height measured in the field.
For example, if the photoload herbs height is 1 meter and the matched loading is 2.0 kg m–2 but the observed height of the herbs in the field is 2 meters, then the actual loading would be twice the estimated loading, computed as 4.0 kg m–2 (2.0 kg m–2 x 2 meters / 1 meter) because the height in the field is twice the height in the photoload picture.
Relation with other methods
The plot design and method are similar to the Photoload sampling technique for surface downed dead woody fuel estimation method
Illustrations
Data templates
NA
Further information
Keane, Robert E.; Dickinson, Laura J. 2007. The photoload sampling technique: estimating surface fuel loadings from downward-looking photographs of synthetic fuelbeds. General Technical Report RMRS-GTR-190. Fort Collins, CO: U.S. Department of Agriculture, Forest Service, Rocky Mountain Research Station. 44 p. https://research.fs.usda.gov/treesearch/26755
DRYAD Protocol for the fuel estimate, sampling and characterization University of Sassari and CNR-IBE V. 27.10.2025
Sikkink, Pamela G.; Lutes, Duncan C.; Keane, Robert E. 2009. Field guide for identifying fuel loading models. Gen. Tech. Rep. RMRS-GTR-225. Fort Collins, CO: U.S. Department of Agriculture, Forest Service, Rocky Mountain Research Station. 33 p